


From Projects to Markets: What Bottom-Up Capital Project Data Reveals About the Future of U.S. Civil Infrastructure
The broad infrastructure story is usually told from the top down. The more revealing view starts with the projects themselves.
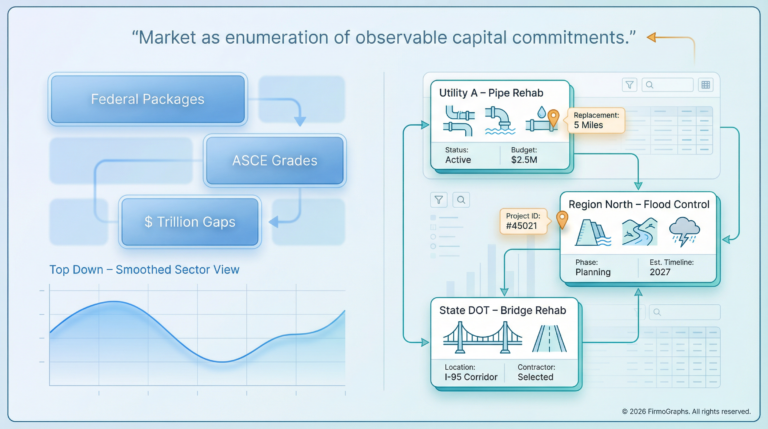
Most infrastructure debates live at 30,000 feet. We talk about trillion-dollar gaps, grades on national report cards, and historic spending bills. Useful, certainly — but also abstract. If one wants to see where U.S. civil infrastructure is actually heading, the more honest record lies closer to the ground: in the capital projects that cities, states, and utilities quietly approve every week.
That bottom-up view is where Firmographs is especially useful. Rather than starting with a single large number for civil infrastructure construction, it starts with the project landscape itself and asks a simpler question: taken together, what do these decisions suggest about the market that is taking shape?
Projects as quiet truth-tellers
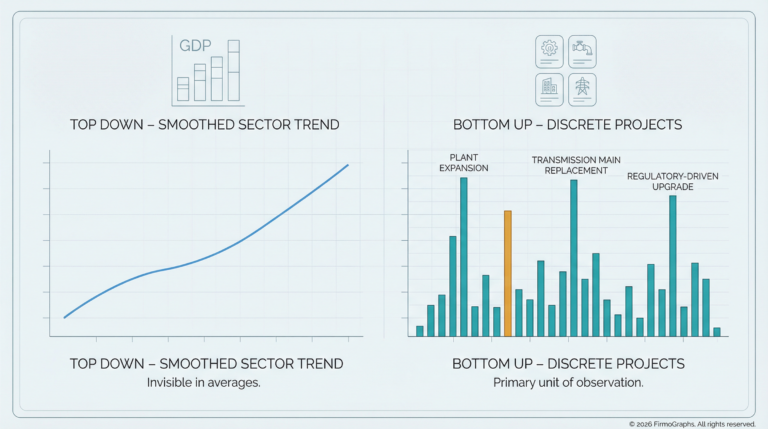
Each capital project is a small economic wager. A flood-control upgrade instead of a lane expansion says something about how an agency values resilience relative to capacity. A programme to replace ageing pipes, rather than keep patching leaks, signals a shift from crisis management to asset stewardship. One project on its own is anecdote; a pipeline of projects is evidence.
Look across that pipeline and several things come into focus. Where spending is tilting from expansion to renewal. Where resilience — drainage, hardening, redundancy — is becoming standard scope rather than an optional line item that gets cut in value engineering. Where digital monitoring and automation are quietly moving from pilot schemes into ordinary civil work orders.
Projects function as revealed preferences. They show what infrastructure owners are genuinely willing to pay for — not merely what they say in strategy documents.
A city that commissions the same type of stormwater upgrade across six consecutive procurement cycles is telling the market something quite specific. That kind of signal is hard to extract from a macro indicator, but it is readily visible when you read projects at scale.
A sharper view than headlines
Top-down indicators still matter, and they set the stakes clearly. ASCE’s 2025 Report Card gave U.S. infrastructure an overall grade of C — the highest since the assessment began — with eight categories improving since 2021, while nine remained in the D range. ASCE also estimates the country needs about $9.1 trillion in infrastructure investment across 2024–2033, against roughly $5.45 trillion in expected public and private funding, leaving a gap of approximately $3.7 trillion.
That is an important national picture. But what it cannot show is how that gap is being navigated in practice — project by project, agency by agency, region by region. Some areas are rebalancing toward reconstruction, safety, and drainage rather than building new capacity. Certain asset classes — select corridors, port facilities, water treatment infrastructure — are becoming more systematically investable. Other systems, including local roads, stormwater networks, and smaller transit fleets, remain dominated by reactive, episodic work driven by emergency conditions or grant deadlines rather than strategic asset management.
There is also a timing dimension that aggregates obscure. Much of the recent momentum has been driven by short-term funding from the 2021 Infrastructure Investment and Jobs Act, whose authorizations were set to expire in 2026. Compounding the challenge is a persistent workforce shortage across engineering, construction, and inspection roles — meaning that even as funding has increased, many owners lack the in-house staff or contractor capacity to deliver projects at scale. Available capital is real, but delivery capacity remains the binding constraint.
How Firmographs can help
This is where the Firmographs perspective becomes most useful. It helps market participants move beyond the broad claim that “infrastructure spending is rising” and toward a more discriminating view of where durable, repeatable demand is genuinely forming — and where it is not.
Treating projects as data rather than news makes a different set of questions answerable. Where are similar project types clustering, suggesting a programme that will sustain a pipeline of work? Where are resilience features or digital specifications appearing consistently in scope, signalling that the market has absorbed them as baseline requirements? Where do the same owners and suppliers appear together repeatedly, hinting that delivery capacity and informal standards are accumulating in specific sub-markets?
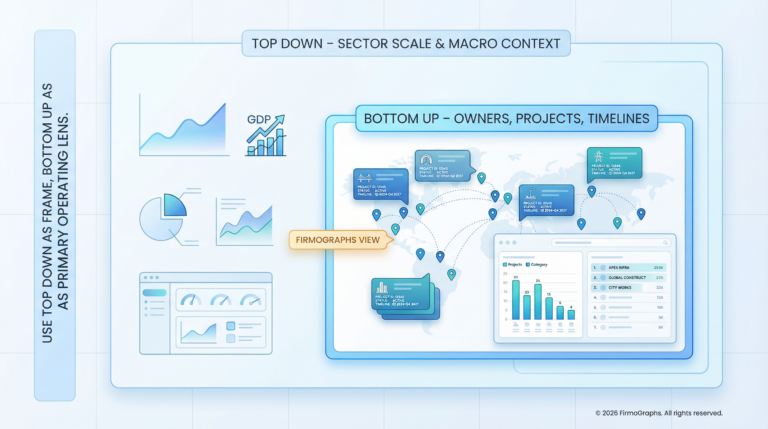
For investors, contractors, and technology firms, the difference between a market that is deepening and one that is merely spending is the difference between a durable opportunity and an episodic one. Firmographs offers a practical way to tell them apart — not by predicting policy, but by reading the evidence that projects themselves generate.
What to watch in the next cycle
The U.S. infrastructure story is entering a more demanding phase. The broad narrative — historically large federal packages meeting chronically underfunded systems — is already written. What follows is a quieter, harder test: whether agencies can convert appropriations into coherent multi-year programmes, whether contractors can sustain delivery under labour and material constraints, and whether digital tools can meaningfully improve how capital is prioritised and spent.
For that phase, project-level evidence matters more than ever. It reveals which categories of work are becoming repeatable rather than ad hoc, where resilience is being priced into ordinary scope rather than merely wished for, and which parts of the market are deepening structurally rather than responding to a temporary funding pulse.
The future of U.S. civil infrastructure will not arrive all at once in a single legislative package. It will arrive project by project, in the quiet accumulation of choices about what to repair, what to modernise, and what can no longer responsibly be deferred. That is the story Firmographs is positioned to track — less theatrical than the headlines, but considerably closer to the truth.
© 2026 FirmoGraphs. All rights reserved.